The bar chart below shows the proportion of the population aged 65 and over of three countries in 1980 and 2000 and prediction in 2030.
Summarise the information by selecting and reporting the main features, and make comparisons where relevant. Write at least 150 words.
 Giải bởi Vietjack
Sample 1:
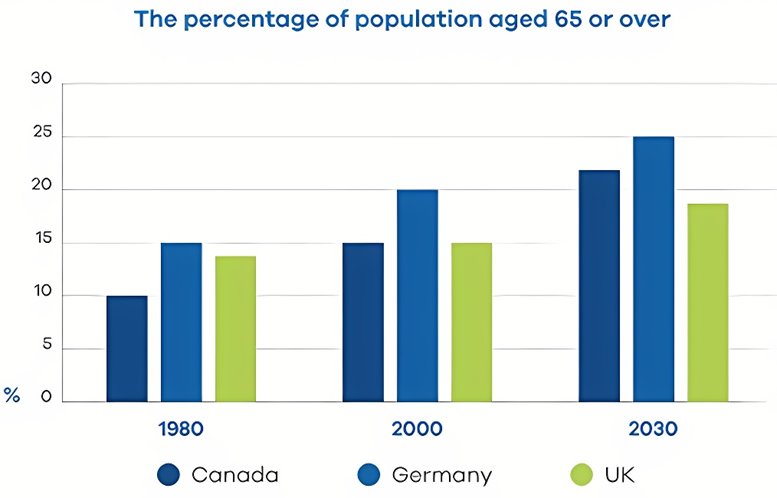
The chart shows the percentages of the population aged 65 and over in Canada, Germany, and the UK, in 1980, 2000, and projected figures for 2030.
Overall, Germany’s population had the largest percentage of people aged 65 and over. In addition, the predicted figures for 2030 show that Canada will see the biggest growth in the elderly population.
In 1980, 15% of the German population was aged 65 and over. This figure had risen to 20% by the year 2000. Meanwhile, the figures for the UK and Canada were approximately 14% and 10% respectively in 1980, with both countries rising to 15% by 2000.
Projected figures for 2030 show a further 5% increase in Germany’s elderly population, reaching 25%. Canada will see an even larger increase of 7% by 2030, which will make around 22% of their population aged 65 and over. Meanwhile, around 18% of the UK population is predicted to be aged 65 and over by the year 2030.
Sample 2:
The bar chart delineates the proportion of individuals aged 65 and older in three nations - Canada, Germany, and the UK - across three distinct years: 1980, 2000, and a projection for 2030. Each country’s data is represented in percentages.
An overview of the data reveals that Germany consistently exhibits the most substantial growth in its senior population, with projections indicating a continuation of this trend. Conversely, the UK demonstrates a slower and fluctuating growth pattern, although it is expected to see an appreciable increase by 2030.
In more detail, Germany's senior demographic experienced a significant upsurge from 1980 to 2000 and is anticipated to reach 25 percent by 2030. This rising trend underscores Germany's increasing older population, which notably surpasses that of the other two countries. Canada, while showing less dramatic increases than Germany, still follows a clear upward trajectory. From holding 10 percent of its population within the senior age bracket in 1980, it rose to 15 percent in 2000, with a forecast of approaching 23 percent by 2030.
The UK, however, presents a more nuanced scenario. In 1980, the percentage of the population aged 65 or over was slightly higher than in Canada but decreased by the year 2000. Nevertheless, projections suggest a recovery to around 18 percent by 2030. This illustrates a more gradual and less consistent growth in the elderly population compared to Canada and Germany, reflecting different demographic dynamics.
Sample 3:
The bar chart illustrates the percentage of the population aged 65 and above in three countries - Canada, Germany, and the UK - over three specific years: 1980, 2000, and a projection for 2030. The figures are presented as percentages, highlighting trends in aging demographics.
A general examination of the chart shows that Germany has the most pronounced increase in its elderly population, with continued growth anticipated through to 2030. In contrast, the UK's aging population growth is slower and exhibits some fluctuations, though a notable rise is forecasted for 2030.
Delving into specifics, Germany’s older population surged markedly between 1980 and 2000, with the projection indicating a rise to 25 percent by 2030. This trend emphasizes a significant aging population in Germany, far exceeding that observed in the other two nations. In Canada, the increase in the senior age group has been less dramatic but nonetheless steady. The data show an ascent from 10 percent in 1980 to 15 percent in 2000, with expectations of reaching approximately 23 percent by 2030.
Meanwhile, the UK's situation is somewhat more complex. Initially, in 1980, the share of the population aged 65 and over was marginally above Canada’s but saw a decrease by 2000. Projected figures suggest a rebound to around 18 percent by 2030, indicating a more moderate and uneven progression of the aging population in comparison to the steady and robust growth observed in Canada and Germany.
Sample 4:
The chart shows changes in the number of people in 65-year-old and over in three nations in the years 1980 and 2000 and predicts the share of this population group in 2030. The units are measured in percentage.
Overall, Germany and Canada show the most significant and consistent increase in the population rate of over-65 age group during 50-year period. However, the UK experiences a slow rise over the period of 50 years, despite a decline in 2000.
Germany saw the biggest rise in people aged over 65 in the first 20 years, and this percentage is likely to increase to 25 percent in 2030. Similarly, Canada also had an upward trend of population growth over-65 age bracket at 15 percent in the year 2000, and this percentage rate is predicted to remain rise to around 23 percent in 2030.
On the other hand, the 65 and above age group’s percentage share of population in the UK in 1980 was nearly 13 percent, which increased to 15 percent in 2000. However, the figure for the UK is expected to rise to 18 percent in 2030, which the growth of people aged above 65 still slower than that of Canada and US.
Sample 5:
The bar chart indicates the growth of population aged 65 and above in three countries between 1980 and 2000, with the projections towards 2030.
Overall, what stands out from the graph is that the percentage of senior demographics aged 65 and older has been on the rise since 1980 and is predicted to continue in 2030. It is also clear that Germany always heads the list over the surveyed period.
In 1980, 15% of the population was the elderly 65 or above in Germany, as opposed to 14% in the UK and only 10% in Canada. Twenty years later, these figures grew steadily by 5% in Germany and Canada, whilst the UK only saw a slight increase of 1%.
In 2030, both Germany and Canada expect a respectable rise in the rate of senior people 65 and over to reach a peak of 25% and 22% respectively. Meanwhile, it is anticipated that there will be around 19% of people aged 65 and older in the UK in 2030.
Sample 6:
The vertical bar graph illustrates the proportion of the population aged 65 and over in Canada, Germany, and the UK, in 1980, 2000, and projected figures for 2030.
In 1980, 15% of the German population was aged 65 or over. By 2000, this figure had risen to 20%. Meanwhile, rates for the United Kingdom and Canada were roughly 14% and 10% respectively in 1980, and by 2000 both countries had risen to 15%.
Projected figures for 2030 show a further 5% increase in the elderly population in Germany, reaching 25%. By 2030, Canada will experience an even bigger growth of 7%, which will account for about 22% of their population aged 65 and over. Meanwhile, around 18% of the United Kingdom population is predicted to be aged 65 and over by the year 2030.
Overall, the German population had the largest percentage of people aged 65 and over. In addition, projected figures for 2030 show that Canada will see the largest increase in the elderly population.
Sample 7:
The graph details the percentages of elderly people in the past with an outlook for the future in Canada, Germany, and the UK.
From an overall perspective, there is no doubt that the elderly population has risen and is predicted to continue to grow steadily.
If we look at the countries separately, Germany has and will continue to have the highest proportion, while Canada will likely overtake the UK. In 1980, Germany had the greatest percentage of elderly at 15%, slightly above the UK and 5% higher than Canada.
By 2000, percentages for Germany and Canada both surged by 5% (to 20% and 15%, respectively), compared to the UK, which rose marginally to equal with Canada. By 2030, Germany is expected to rise by another 5% to 25%, with Canada surpassing the United Kingdom and finishing at 22% and the latter’s figures lagging behind slightly at just under 20%.
Sample 8:
The graph given puts forward a series of data for the elderly people in Canada, Germany, and the UK in the past with projections for the future, looking from an overall perspective. It provides an apparatus to understand that the Elderly population have risen and are predicted to continue to grow steadily in the mentioned countries. While the trend of the rising elderly population is evident, Germany has indicated to have the highest proportion, and that Canada will likely overtake the UK.
At 15%, Germany had the greatest percentage of elderly in 1980, this is slightly above the UK and Canada. By 2000, percentages for Germany and Canada both surged by 5% (to 20% and 15%, respectively), compared to the UK which rose marginally to equal with Canada. By 2030, Germany is expected to rise by another 5% to 25%, with Canada surpassing the United Kingdom and finishing at 22% and the latter’s figures lagging behind slightly at just under 20%.
Sample 9:
The chart illustrates the proportions of the elderly population in Canada, Germany, and the UK in 1980, 2000, and projected figures for 2030.
Overall, Germany’s population had the largest percentage of people aged 65 and over. In addition, the predicted figures for 2030 show that Canada will see the biggest growth in the elderly population.
In 1980, 15% of the German population was aged 65 and over. This percentage had increased to 20% by the year 2000. Meanwhile, the percentages for the UK and Canada were approximately 14% and 10% respectively in 1980, both rising to 15% by 2000.
Projected figures for 2030 indicate a further 5% increase in Germany’s elderly population, reaching 25%. Canada is expected to experience an even larger increase of 7% by 2030, making up around 22% of their population aged 65 and over. Meanwhile, around 18% of the UK population is forecasted to be aged 65 and over by the year 2030.
Sample 10:
The graph details the percentages of elderly people in Canada, Germany, and the UK in the past with projections for the future. Looking from an overall perspective, it is readily apparent that Elderly populations have risen and are predicted to continue to grow steadily in all countries. Germany has and will continue to have the highest proportion, while Canada will likely overtake the UK.
In 1980, Germany had the greatest percentage of elderly at 15%, slightly above the UK and 5% higher than Canada. By 2000, percentages for Germany and Canada both surged by 5% (to 20% and 15%, respectively), compared to the UK which rose marginally to equal with Canada.
By 2030, Germany is expected to rise by another 5% to 25%, with Canada surpassing the United Kingdom and finishing at 22% and the latter’s figures lagging behind slightly at just under 20%.
2000 câu trắc nghiệm tổng hợp Tiếng Anh 2025 có đáp án (Phần 18)
The map below shows a school in 1985 and the school now.
Summarise the information by selecting and reporting the main features, and make comparisons where relevant. Write at least 150 words.
The chart below shows the percentage of the population in the UK who consumed the recommended daily amount of fruit and vegetables in 2002, 2006 and 2010.
Summarise the information by selecting and reporting the main features, and make comparisons where relevant. Write at least 150 words.
The two charts below show the proportion of qualified graduates in a particular country.
Summarise the information by selecting and reporting the main features, and make comparisons where relevant. Write at least 150 words.
The maps indicate how Huntingdon has changed throughout time, both in terms of present changes and anticipated future changes.
Summarise the information by selecting and reporting the main features, and make comparisons where relevant. Write at least 150 words.
The charts show the percentage of volunteers by organizations in 2008-2014.
Summarise the information by selecting and reporting the main features, and make comparisons where relevant. Write at least 150 words.
The diagram below shows how a modern landfill for household waste is designed.
Summarise the information by selecting and reporting the main features, and make comparisons where relevant. Write at least 150 words.
The chart below shows the amount of energy generated from wind in four countries from 1985 to 2000.
Summarise the information by selecting and reporting the main features, and make comparisons where relevant. Write at least 150 words.
The table details the international tourist arrivals (in millions) in 8 countries in 2009 and 2010 and the changes (in percentages).
Summarise the information by selecting and reporting the main features, and make comparisons where relevant. Write at least 150 words.
The table and the chart below provide a breakdown of the total expenditure and the average amount of money spent by students per week while studying abroad in 4 countries.
Summarise the information by selecting and reporting the main features, and make comparisons where relevant. Write at least 150 words.
The table below shows the percentage of working men and women in different areas of employment in one country in 1986, 1996 and 2006.
Summarise the information by selecting and reporting the main features, and make comparisons where relevant. Write at least 150 words.
The line graph shows the number of people who used different communication services in the world.
Summarise the information by selecting and reporting the main features, and make comparisons where relevant. Write at least 150 words.
The charts below show the water levels of 6 cities in Australia in October 2009 and 2010.
Summarise the information by selecting and reporting the main features, and make comparisons where relevant. Write at least 150 words.
CÔNG TY TNHH ĐẦU TƯ VÀ DỊCH VỤ GIÁO DỤC VIETJACK
- Người đại diện: Nguyễn Thanh Tuyền
- Số giấy chứng nhận đăng ký kinh doanh: 0108307822, ngày cấp: 04/06/2018, nơi cấp: Sở Kế hoạch và Đầu tư thành phố Hà Nội.
2021 © All Rights Reserved.